|
CERN openlab II - Platform CC -
Optimization
Performance Monitors
Modern
processors have special hardware for performance monitoring.
They implement a set of event detectors and a set of
counters to collect relevant micro-architectural events.
These events can be important clues for system and software
optimization. For example, counters can collect the number
of executed instructions, the number of integer and floating
point instructions, the cache misses, the number of
predicted and mispredicted branches etc. Unfortunately the
implementation of the performance monitoring hardware
differs between processors. As a result there is no
standardized interface for accessing these hardware
facilities. Since we have many different machines in openlab,
we have to juggle with different hardware implementations,
interfaces, libraries and tools. Our current performance
monitoring stack is shown on the picture below.
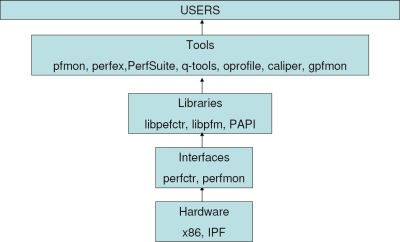
Interfaces
Both interfaces are integrated into the kernel. We take
advantage of perfctr on our machines with the 2.4
kernel and x86 processors (P4/Xeon). On the Itanium servers
as well on x86 servers with the 2.6 kernel we use permon2.
Each interface comes with a corresponding library but there
is also the cross platform library
here.
The best choice is to track execution context switches,
implying that the performance interface and its
implementation must be an integral part of the operating
system. In other words it must be built into the kernel.
Two different interfaces exist to access the hardware
monitoring unit –
permon2
and
perfctr.
Both interfaces are integrated into the kernel. We take
advantage of perfctr on our machines with the 2.4
kernel and x86 processors (P4/Xeon). On the Itanium servers
as well on x86 servers with the 2.6 kernel we use permon2.
Each interface comes with a corresponding library but there
is also the cross platform library
–
PAPI.
Tools
Depending on the purpose of the performance monitoring we
use a variety of tools. Some of them are small and dedicated
only to a specific processor, and some of them are very
robust and portable across many hardware platforms. For
simplistic counting and sampling we use
pfmon and perfex.
These tools come from the interfaces discussed above. We
also developed a tool gpfmon in a collaboration with
the FIO group. It takes advantage of the perfctr
library and has been used in order to monitor our batch
system at CERN.
More
details about tools and results you can find in resources,
at the bottom of this page.
Resources
Measuring HT-Enabled Multi-Core: Advantages of a
Thread-Oriented Approach
Intel® Pentium® 4 and Intel® Xeon™Processor Optimization
Pentium®
4 Performance- Monitoring Features
IA-32 Intel® Architecture Software Developer’s Manual Volume
3B: System Programming Guide, Part 2
Itanium®
2 Processor Microarchitecture
Introduction to Microarchitectural Optimization for Itanium®
2 Processors
Intel® Itanium® Architecture Software Developer’s Manual
Volume 1: Application Architecture
Intel® Itanium® 2 Processor Reference Manual For Software
Development and Optimization
Dual-Core Update to the Intel® Itanium® 2 Processor
Reference Manual
Optimization and Tuning for Intel®
Processors
A Methodology for using the Itanium®
2 Performance Counters
for Bottleneck Analysis
Our
Presentations
Practical experience with
performance monitors on Xeon and Itanium®
Practical experience with performance monitoring
|